


This post originally appeared on Single Grain, a growth marketing agency focused on scaling customer acquisition.  Consider this: every 30 seconds, online businesses make just over $1.2 million:
 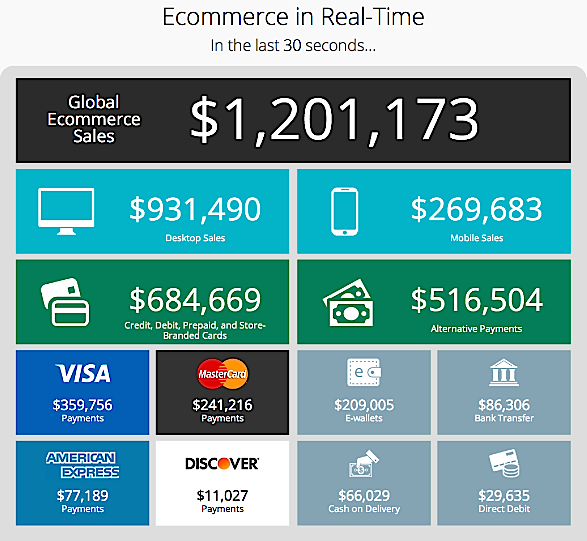 It’s a small reminder that there’s a massive amount of money to be made on the Internet. If you’re already receiving even a small piece of that 30-second money, congratulations. But once you start making money, something’s going to happen: you’ll start thinking about where your money is coming from and how you can get more of it. Then you begin calculating your ROI and you realize something: you don’t know exactly where your money is coming from. The truth of the matter is that ROI is a lot more complicated than most people make it out to be. That’s not to say that the average person can’t understand the basics of Google Analytics, but measuring marketing ROI is a lot more complicated. It’s determined by all the unique channels that drive traffic to what you’re selling. So how do you track your website’s revenue accurately? By asking better questions. Yes, you’re accruing money from your website, but why? (And if you’re not curious enough to ask “why?” then you’re not thinking like an entrepreneur.) Which part of your website is drawing the most attention? What part are people skipping over? Can you place a dollar amount on any random visitor who happens to come across your site? Once you start to ask these questions, your business will grow and you can start looking at your online presence through a more objective lens, which will allow you to:
In this post, we’ll go over the different methods for tracking your website’s revenue with Google Analytics.
If you’re selling a product (whether physical or digital), you’ll want to track it and the best way to do that is through the use of custom code embedded in your shopping cart. This type of tracking will allow you to determine a few things:
In essence, you’ll discover which parts of your website are most effective for your sales funnel – and which ones aren’t doing you much good. You might find, for instance, that one of your landing pages is leading to a 20% conversion rate while another is underperforming at 5%, in which case you might want to reconsider how you built that landing page. Knowing the proper steps to building – and testing – a dynamite landing page can be transformational for your conversion rates. Learn more: 5 Important Landing Page Elements You Should Be A/B Testing But before you can play with the data, you’ll first need to enable e-commerce analytics by logging into Google Analytics and switching the “E-Commerce set-up” radio button in the Main Website Profile Information from “Off” to “On.”  The next step is a little more complicated. You’ll need to add a customized tracking code to your shopping cart system that reports when and how purchases occurred. Depending on your hosting and shopping cart providers, this may be done through a server-side inclusion, a separate module through your content system, or through hand-coded HTML. For more details on how to finish this integration, check out Google’s E-commerce Tracking documentation.
Now, suppose you don’t sell any products on your site, but instead use your page to generate leads for an offline business. In this case, every visitor to your site has a monetary value, although this isn’t determined by the number of sales that result from a traditional shopping cart system. Ideally, the revenue generated from the time and effort you invest into promoting your website should increase over time. To track whether or not this is the case, you’ll want to make use of “Goals” within Google Analytics. To do so, log into your Analytics account and navigate to “Conversions” > “Goals” where you’ll have the option of setting up new Goals.  Although you have several different Goal types you can play around with, Event Goals (goals that aren’t tied to arrival on a specific site URL) make the most sense for tracking revenue from non-e-commerce sites, as they allow you to set a custom event value for each circumstance you define. On a basic level, your Goals will evaluate every visitor that comes to your site by using a simple equation. Take the amount of money you’ve made and divide it by how many new (unique) visitors have come to your site. That will tell you how much each new visitor is worth. But that’s just scratching the surface. If you want to truly understand your sales funnel, Goals can help you track much more specific data. For example, say you generate leads using a free white paper on your site. You’ve already determined that the average value of a visitor who contacts your company in this manner is worth $20. Now, you can set up an Event Goal accordingly. This lets you track how potential leads move through your site so you can optimize your site structure for maximum conversions.
Tying your Google Analytics account to your AdWords accounts can give you some very valuable information about the efficacy of your PPC campaigns, including which keywords result in conversions, what AdWords visitors do once they land on your site, and much more. 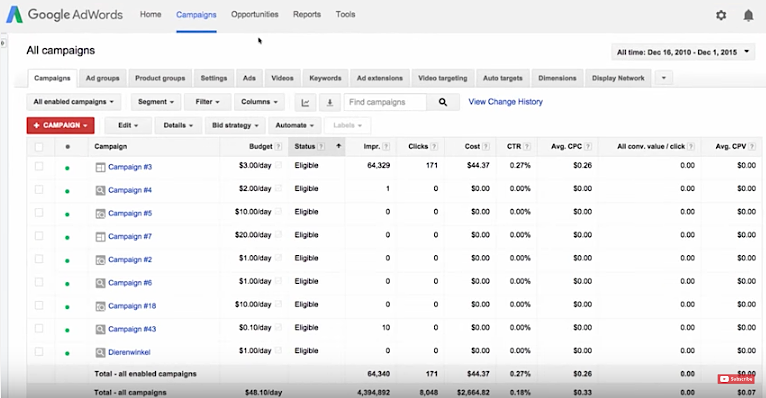 Read more: 13 Quick Tricks to Increase Conversion Rates that You Can Do Right Now The best part is that setting up this integration is incredibly simple. If you use the same e-mail address to log into both your Analytics and AdWords accounts, all you have to do is open up your AdWords account, navigate to the “Reporting” tab, and click on “Google Analytics.” Select “I already have a Google Analytics account,” then choose the correct account profile from the list. In the next section, you’ll have the opportunity to select and deselect a number of checkboxes – including one that gives you the option of turning off auto-tagging. For most beginners, we recommend leaving auto-tagging on. This is an easy way to tie your keywords to your campaign links (otherwise you have to manually add tracking variables to every link in your account). You’ll also want to take the time to import your cost data from AdWords, as this will allow you to analyze the ROI of all conversions and sales on a per-keyword basis. To do this, follow these steps, as laid out by Google Support:
For those who are more visual, here’s a short how-to video:
As with the Google AdWords/Google Analytics integration described above, pairing Google’s website statistics manager with your AdSense account can result in several types of useful data, including the ability to view earnings based on user visits (rather than just page impressions). For instance, if you’re blogging (and you should be), this is a fantastic way to analyze the trends in your blogs to see what’s working for you. You can view:
Finding out this information allows you to open up channels for additional revenue or see what is actually helping your website to convert. And those are just some of the things you can discover. You’ll also be able to view click data based on user location, browser type, and referral source – all of which can help you refine your content-based ad monetization strategy. It can even help you discover which areas require growth. If, for example, you see that the majority of your web traffic comes from New York but the majority of your sales come from Los Angeles, you can rethink your strategy to compensate for a specific region.  To connect your Analytics and AdSense accounts, look for a link inviting you to do so in the Overview or Advanced Reports pages of your AdSense account. If you aren’t yet eligible, keep checking back to take advantage of this feature in the future.
One final way you can use Google Analytics to track website ROI is to break out revenue stream by traffic type. Most webmasters advertise their sites in a number of different ways, including PPC ads, content marketing, social networking, forum marketing, etc. However, since it’s likely that not all of these activities result in the same ROI, it’s a good idea to break them apart to see which traffic source results in the most income. This will help you determine how to best allocate future promotional efforts. To do this, you’ll need to set up Advanced Traffic segments, which allow you to break out visitors based on referral sites to see which types of traffic are converting best for you. Start by clicking on the “Advanced Segments” tab under the “Standard Reporting” tab of your Google Dashboard. You’ll see that some default segments have been included, but you can also use the button in the lower right-hand corner to create your own segments based on specific sites or types of sites.  A few potential traffic segments you could create include:
Once these segments are set up, filter your Goal conversions by segment to compare which traffic streams are most profitable for your site.
If this is your first time attempting to track your revenue through Google Analytics, it might seem daunting. Whenever you feel overwhelmed, just remember that these techniques can and will contribute to your bottom line:
Even if you aren’t actively tracking your website ROI, keep in mind that your competition sure as heck is. These tools are helping them acquire new clients that you could be getting! That’s why knowing how to properly measure revenue and conversion rates can help you stay ahead of the curve. Remember: online businesses make $1.2 million per 30 seconds, or about $3.5 billion per day. How much of that are you taking home? Need help tracking your revenue with Google Analytics? While other agencies love to talk about “ad spend,” at Single Grain we’re all about the ROI. [sg_alert type=”success”]Get a free consultation right now to see how we can help grow your business![/sg_alert]
Enter your email to get free instant access


